
Impacts of climate change – CO2 emissions and ocean acidification (student instructions)
Experimentation instructions:The experiment provides a practical way to verify the fact that carbon dioxide leads to the acidification of liquids. The students first become acquainted with the digital pH value meter. Then they look for an experiment setup with which they can prove that carbon dioxide results in the acidification of water. At the end, the students should infer from the experiment the correlations to ocean acidification through the greenhouse gas carbon dioxide.
Impacts of climate change – CO2 emissions and ocean acidification (teacher instructions)
Experimentation instructions:These instructions provide background information on the content and practical notes on conducting the “CO2 emissions and ocean acidification” experiment. Students know that CO2 (and other greenhouse gases) is emitted through human activities and that these CO2 emissions are responsible for climate change. One impact of CO2 emissions is ocean acidification. The CO2 dissolves in the ocean and reacts with the water. This reaction produces carbonic acid and the acid content of the ocean increases. With the experiment, the students will show that CO2 leads to ocean acidification.Notes: • In place of the digital pH meter, the students can use a swimming pool test kit, also called a pool tester. If they use a pool tester, no colored liquids should be used (such as a colored acidic soft drink) because the color can distort the measured value.Litmus paper is not recommended for this experiment since the measurements are not precise enough.

Meat and Sustainability
Video Video:Animated film that clearly shows the impact of high meat consumption in Germany

On our plates or in our tanks – energy from biomass
Video Video (01:29 minutes):Presents the advantages and disadvantages of biofuels. The video starts by describing the advantages of using biofuels. During photosynthesis, the same amount of carbon dioxide is “consumed” by corn, rapeseed, and sugarcane plants as is released when these plants are burned as fuel. The energy produced from biomass is therefore considered climate-neutral.Nevertheless, the increased use of biofuels has negative consequences. Plants used for biofuel are no longer available as food, and the rising demand causes an increase in food prices. Two diagrams serve to illustrate the problem.This video is an excerpt from the teaching DVD, „Das grüne Paradoxon – Warum die Erde wärmer wird".

Greenhouse effect
Video Video (01:24 minutes):Explains the principle of the greenhouse effect and its importance for the Earth’s ecosystem.

Historical evolution of land use
Video Video (00:54 minutes):The Earth’s forests are increasingly being replaced by agricultural space.

Understanding global warming – Climate and the atmosphere (video)
Video Video:The video explains climate changes in the course of Earth’s history as well as climate change intensified by humans. Climate change has always existed on Earth; ice ages alternated with interglacials. The Industrial Revolution marks a point in time from which global warming has progressed rapidly. The anthropogenic greenhouse effect is to blame. The video describes the impacts of global warming as well as measures that can be implemented to limit man-made global warming.
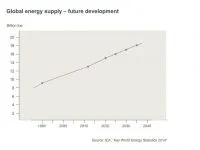
Global energy supply – future development
Bild Chart:The development of the global energy supply from 1990 to 2035 is shown. Reliable figures are available through 2012; from that date forward, the International Energy Agency must rely on estimates. The represented figures refer to the more optimistic New Policies Scenario, which takes into account political announcements and plans of governments, for example, to reduce CO2 emissions, although they have not yet been implemented. The estimated energy consumption for 2035 is 12,001 mtoe.Using the following source: International Energy Agency (IEA)
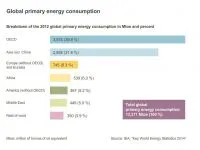
Global primary energy consumption
Bild Chart:Global primary energy consumption in 2012 Chart:A bar chart indicates the extent of primary energy consumption in millions of tonnes of oil equivalents (mtoe) of individual regions of the world and their percentage share of global energy consumption.Information and ideas:The following questions are good for a short presentation: Who or what is the OECD? What are the objectives of the OECD? Which countries are OECD members?Using the following source: International Energy Agency (IEA)

Geothermal power plant
Bild Photo: The pictured geothermal power plant meets the overall heating requirements of the Freiham residential and commercial district west of Munich. Deep water with a temperature of 90°C is pumped from a production well. The heat of this water pumped from a depth of 2,500 m is transferred to the district heating grid via a heat exchanger. After that, the cooled water is pumped down deep again via an injection well. The resulting savings of fossil fuels reduce emissions of carbon dioxide by 22,500 tonnes annually. Besides the pumps and the heat exchanger, the pictured plant also contains a large gas boiler that is used as an emergency power supply in the event the pumps are shut down for maintenance or repair.

Oil drilling rig
Bild Photo:Typical oil drilling rig at the German Oil Museum in Wietze. Incidentally, the first oil wasn’t drilled in the United States or Azerbaijan, but in Germany in Wietze, a town between Celle and Hamburg. That’s why the company headquarters of a global leader in the manufacture of drill bits are still located in Celle today.
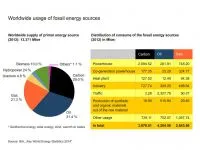
Worldwide consumption of fossil energy sources
Bild Chart and table:The worldwide consumption of fossil energy sources and their use in electric power and heat generation in figures. The pie chart displays the percentage share of fossil energy sources (coal, oil, and natural gas) in the worldwide primary energy supply. The table shows a breakdown by distribution of these fossil energy sources to electric power and heat generation, but also to other areas such as industry. Information and ideas:The chart and table provide the students with an overview of where and to what extent fossil energy sources were used in 2012. These aids can be followed by discussions on the finite nature of these energy sources and on changing over to or expanding the use of renewable energy sources. Additional information can be found in the “An overview of energy sources” information sheet and the “How long will our energy sources last?” graphic.