
Turn Your Text into an Infographic
Use Cases
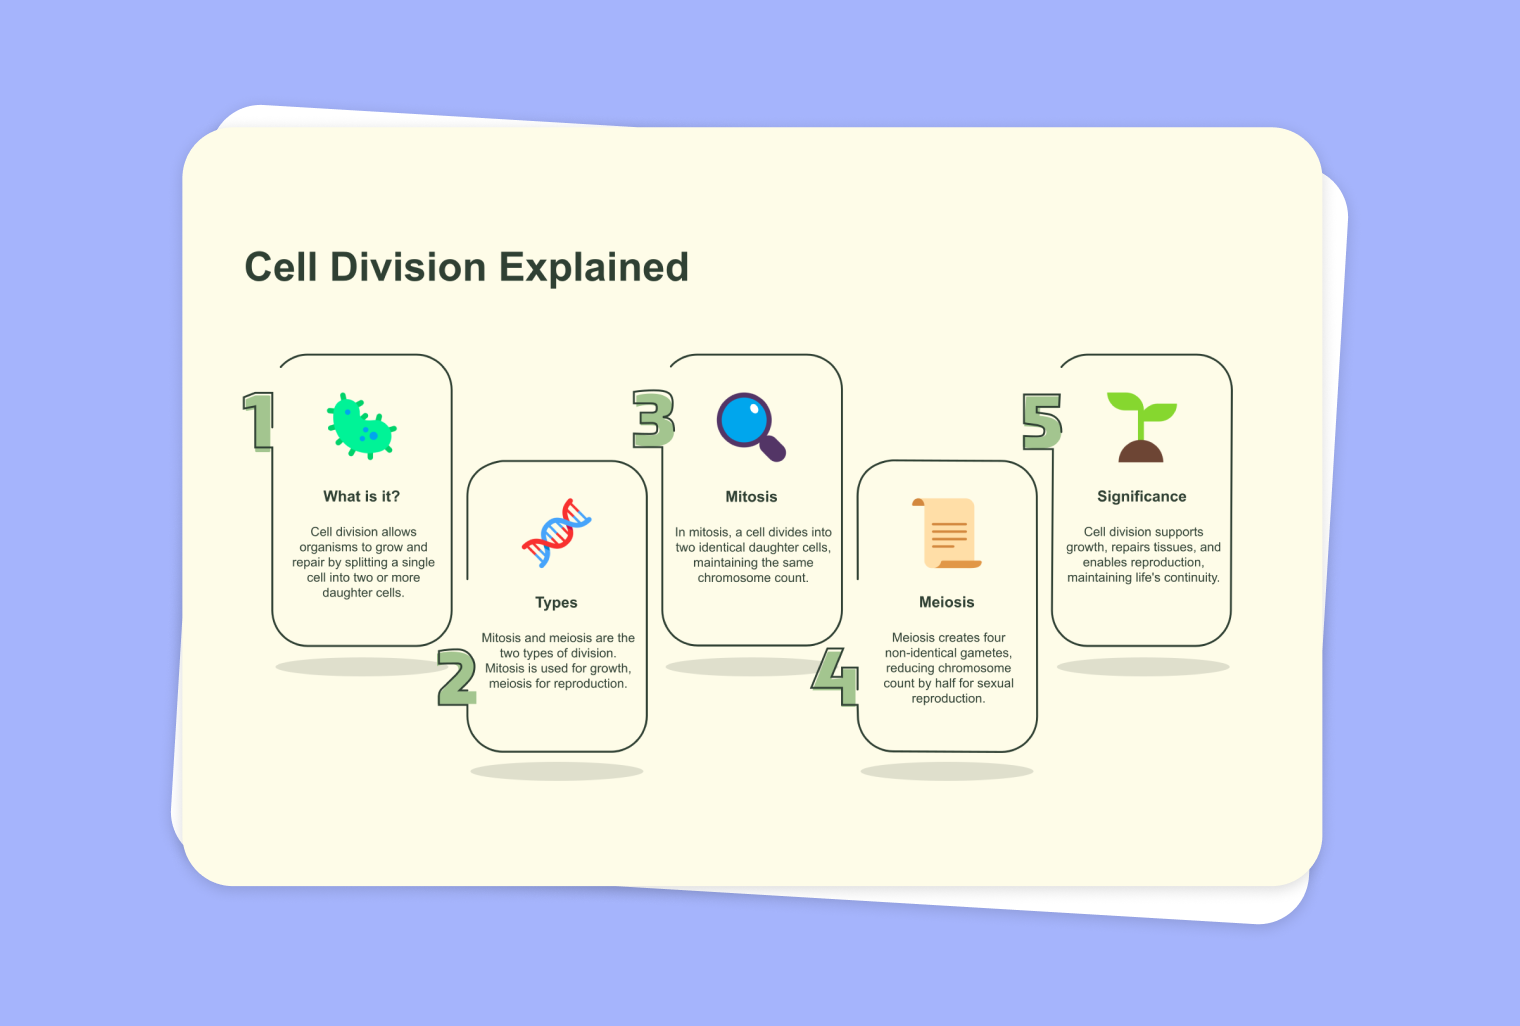
Are you seeking a vibrant, eye-catching way to deliver essential course information? With to-teach.ai, you can seamlessly convert any text into a custom infographic. This feature makes it easy to highlight key concepts, break down dense material, and present facts or statistics in a format students will find engaging and memorable.
Why Use Infographic Creation?
Enhance Visual Learning
Infographics help students grasp complex information quickly by turning words into visual cues, making the learning experience more engaging.Simplify Complex Topics
Suitably structured graphics transform detailed content into concise, organized segments that are easy to digest.Boost Retention
By pairing text with visuals, students are more likely to remember critical points for a longer period.Encourage Collaboration
Use infographics for group presentations or class discussions, fostering teamwork and shared insights.Adaptable Across Subjects
From math formulas to historical timelines to scientific processes, any subject matter can be turned into a visually appealing infographic.
Getting Started
If you want a step-by-step guide, head over to our platform’s tutorial section. There, you’ll discover how to upload your text, choose a template, and customize design elements like color themes, icons, and layouts. Our AI ensures the infographic remains clear and cohesive, so you can focus on helping your learners succeed.
Frequently Asked Questions (FAQ)
How do I convert my text into an infographic using to-teach.ai?
Just paste or upload your text, then select the “Infographic” option. With a click, our AI will instantly transform your content into a visually appealing design.Can I customize the look and feel of the infographic?
Absolutely. You can adjust colors, fonts, and layouts to align with your course theme or school branding.Are there different templates for various topics?
Yes. Our platform features a wide range of infographic templates suitable for diverse subjects, from literature summaries to science or math data.Can I modify the infographic after it’s generated?
Definitely. You can tweak headings, icons, or even data points on the finalized infographic to ensure it matches your exact needs.Is this feature suitable for both K-12 and higher education?
Yes. Infographics are proven to help learners of all ages. You can tailor the complexity and depth of your visuals to match various grade levels and academic settings.
Sign Up for to-teach.ai!
Join more than 100,000 educators who are transforming their lesson planning with to-teach.ai
Sign Up for to-teach.ai!
Join more than 100,000 educators who are transforming their lesson planning with to-teach.ai
Start for free
Use an Image as the Basis for a Crossword Puzzle
Create an engaging crossword puzzle by using any image as the foundation for your lesson setting, enriching vocabulary development and visual learning.
Use Your Image as a Basis for an Essay Writing Task with Feedback
Create an essay writing task including feedback based on your content.

Extract Text from Websites and Convert It to Simplified Language
Easily scrape text from websites and transform it into simpler language for improved accessibility and comprehension.