to teach logo
Sign up

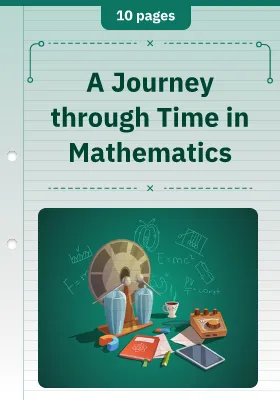
Zeitreise in der Mathematik

TT
by to-teach Team
10 pagesAb der 5. KlasseMathematics
Template

Loading preview…

Your worksheet

Select a civilization or historical period. The math problems and scenarios will then be adapted accordingly, and students will learn more about the number system and calculation methods of that era.

Need an idea?

Popular topics from other teachers

How our AI templates work

  • Content gets adapted

    Examples, texts and tasks match your focus.

  • Method & structure stay

    The didactically reviewed structure of the template won't change.

Description

Zielsetzung:

Das übergeordnete Ziel des Arbeitsblattes ist es, den Lernenden das gewählte Rechensystem der Vergangenheit handlungsorientiert und historisch-kontextualisiert näherzubringen. 

Inhalt und Methoden:

Das vorliegende Arbeitsblatt vermittelt die Grundlagen des Rechensystems einer gewählten Hochkultur/Epoche durch eine fiktive Erzählung aus der Perspektive eines Kindes. Methodisch verknüpft das Dokument ein Richtig/Falsch-Verständnisquiz mit illustrierten Rechenbeispielen. Die Schüler:innen wenden das Prinzip aktiv an, indem sie historische Sachaufgaben aus dem Alltag des Kindes lösen. Den Abschluss bilden offene Reflexions- und Transferfragen, die eine Brücke zum modernen mathematischen Zahlensystem / der Gegenwart schlagen.

Kompetenzen:

  • Arithmetische Kompetenz
  • Text- und Sprachkompetenz: Informationen aus einer Erzählung entnehmen und mathematische Phänomene in eigenen Worten beschreiben
  • Kultur- und Geschichtskompetenz: Reflexion über die Weiterentwicklung von globalen Rechenzeichen und Systemen

Zielgruppe und Niveau: Ab der 5.Klasse

Hinweis: Aufgrund der Hintergrundrecherche zu alten Rechenformen beansprucht die Erstellung des Arbeitsblattes länger.

Similar worksheets

4 Steps for Analyzing Discontinuous Texts: Orient, Analyze, Explain, Question

4 Steps for Analyzing Discontinuous Texts: Orient, Analyze, Explain, Question

This worksheet aims to provide students with a reliable methodological tool for systematically interpreting non-continuous texts—such as diagrams, tables, infographics, and charts—across various subjects. Learners will recognize that, unlike traditional continuous text, these formats cannot simply be read linearly; rather, individual visual elements, numbers, and text blocks must be actively linked together. By systematically applying a 4-step plan, they develop the ability not only to accurately grasp complex data from a wide variety of subject areas but also to interpret it with subject-specific expertise and to critically evaluate the visual representation for its informative value.

Content and Methods:

The worksheet combines methodological guidance with a structured, step-by-step approach. After a brief introduction to the variety of discontinuous texts (including line charts, bar charts, pie charts, data series in tables, thematic maps, and complex diagrams), students develop a systematic 4-step plan. This plan guides them through the analysis process like a detective:

  • Step 1: Orient & Describe: Students identify the topic, type of representation (diagram, table, etc.), axis labels, and symbols used.
  • Step 2: Analyze & Interpret: This involves recognizing patterns and trends, accurately reading values (including maximums and minimums) while specifying the units, and comparing different data sets.
  • Step 3: Explain & interpret: The focus here is on context- or theory-based interpretation; students connect notable features with their prior knowledge and subject-specific expertise and learn to strictly distinguish between pure observation and interpretation.
  • Step 4: Critical Analysis: In the final step, learners evaluate the design of the presentation, such as the selection of data, visual distortions caused by truncated scales, or the relationship between percentages and absolute numbers. The process concludes with a visually organized “cheat sheet” that concisely summarizes the four steps of analysis for future work with other discontinuous texts.

Competencies:

Students can...

  • identify and explain various types of discontinuous texts (e.g., different types of diagrams, tables, charts) and recognize that the reader must independently connect the information presented.
  • navigate complex graphical and tabular representations across disciplines by purposefully identifying and describing key elements such as titles, axes, units, colors, and symbols.
  • objectively analyze depicted patterns, trends, and extreme values (maximum/minimum), compare groups with one another, and precisely read values in relation to their units.
  • Interpret selected data trends from a technical perspective, derive theory-based causes for them, and clearly distinguish in their formulations between objective observation and their own interpretation.
  • Critically evaluate the design of diagrams, tables, or infographics by questioning aspects such as data selection, axis scales that appear manipulative, or the informative value of absolute numbers versus percentages.

Target audience and level: Grade 8 and above


Note: This worksheet is designed as a universal methodological tool. It provides students with a subject-independent 4-step framework for analyzing non-continuous texts. A non-continuous text is required to use this worksheet.

non-subject specific contentBiologyChemistryMathematicsGeography
From Everyday to Academic Language: Analyzing, Formulating & Reflecting

From Everyday to Academic Language: Analyzing, Formulating & Reflecting

This worksheet aims to provide students with a solid understanding of the significance and function of academic language and to help them practice actively using it in subject-specific instruction. Students will recognize that academic language serves as an essential tool for presenting complex topics in an objective, impersonal, and precise manner, and that the ability to switch between everyday language and academic language is a key skill. Through guided practice in translating everyday observations into formal language, they learn to use subject-specific linguistic tools, to put their own thoughts into writing in a structured manner, and to reflectively evaluate their own learning process and linguistic expression.

Content and Methods:

The worksheet combines cognitive awareness, guided writing practice, independent text production, and self-evaluation. After an introductory informational text on the distinction between everyday language and academic language, as well as an introduction to subject-specific language tools (e.g., for cause-and-effect relationships, hypothesis formation, or evaluations), learners gradually translate given everyday statements into logically structured academic language. They then apply this translation technique to their own current course material and reflect on the advantages and challenges of academic language formulation. The module concludes with a structured self-assessment matrix designed to evaluate their own language competencies and identify remaining learning needs.

Competencies:

Learners can...

  • identify the difference between everyday language and academic language and explain the importance of precise technical language for subject-matter understanding.
  • identify and purposefully apply specific subject-specific language tools (e.g., phrasing guides for descriptions, justifications, and analyses).
  • systematically translate colloquial observations into precise, factual, and logically structured sentences using formal language.
  • structure their own conceptual ideas derived from current classroom activities and independently put them into writing using appropriate technical terms.
  • critically reflect on their own language translation process and evaluate their individual strengths and areas for development in the use of formal language.

Target Audience and Level:

Grade 8 and above

non-subject specific contentChemistryBiologyGeographyGerman